Summary
- 15.7 million American passengers transited its Dallas hub in January-May 2023
- The carrier had 1,600+ connecting markets with 2,000+ passengers
- Tucson-Washington Reagan was the most popular market via the Texas hub
As you know, American Airlines is the world's largest airline in many respects, including flights. Dallas Fort Worth is its busiest hub and the world's third-busiest passenger airport. Between January and May 2023, the US DOT data shows that the oneworld airline carried 24.8 million roundtrip passengers to/from its Dallas hub on 235+ non-stop routes. But where did passengers actually go?
A summary
Being a hub, transit passengers are crucial for American in Dallas. I love hub-and-spoke operations, which combine many spokes to make vast numbers of origins and destinations (O&Ds).
For example, passengers can fly American from Kansas City to 230+ destinations via Dallas. It means many flights, routes, and interconnectedness – and Dallas is a brilliant example.
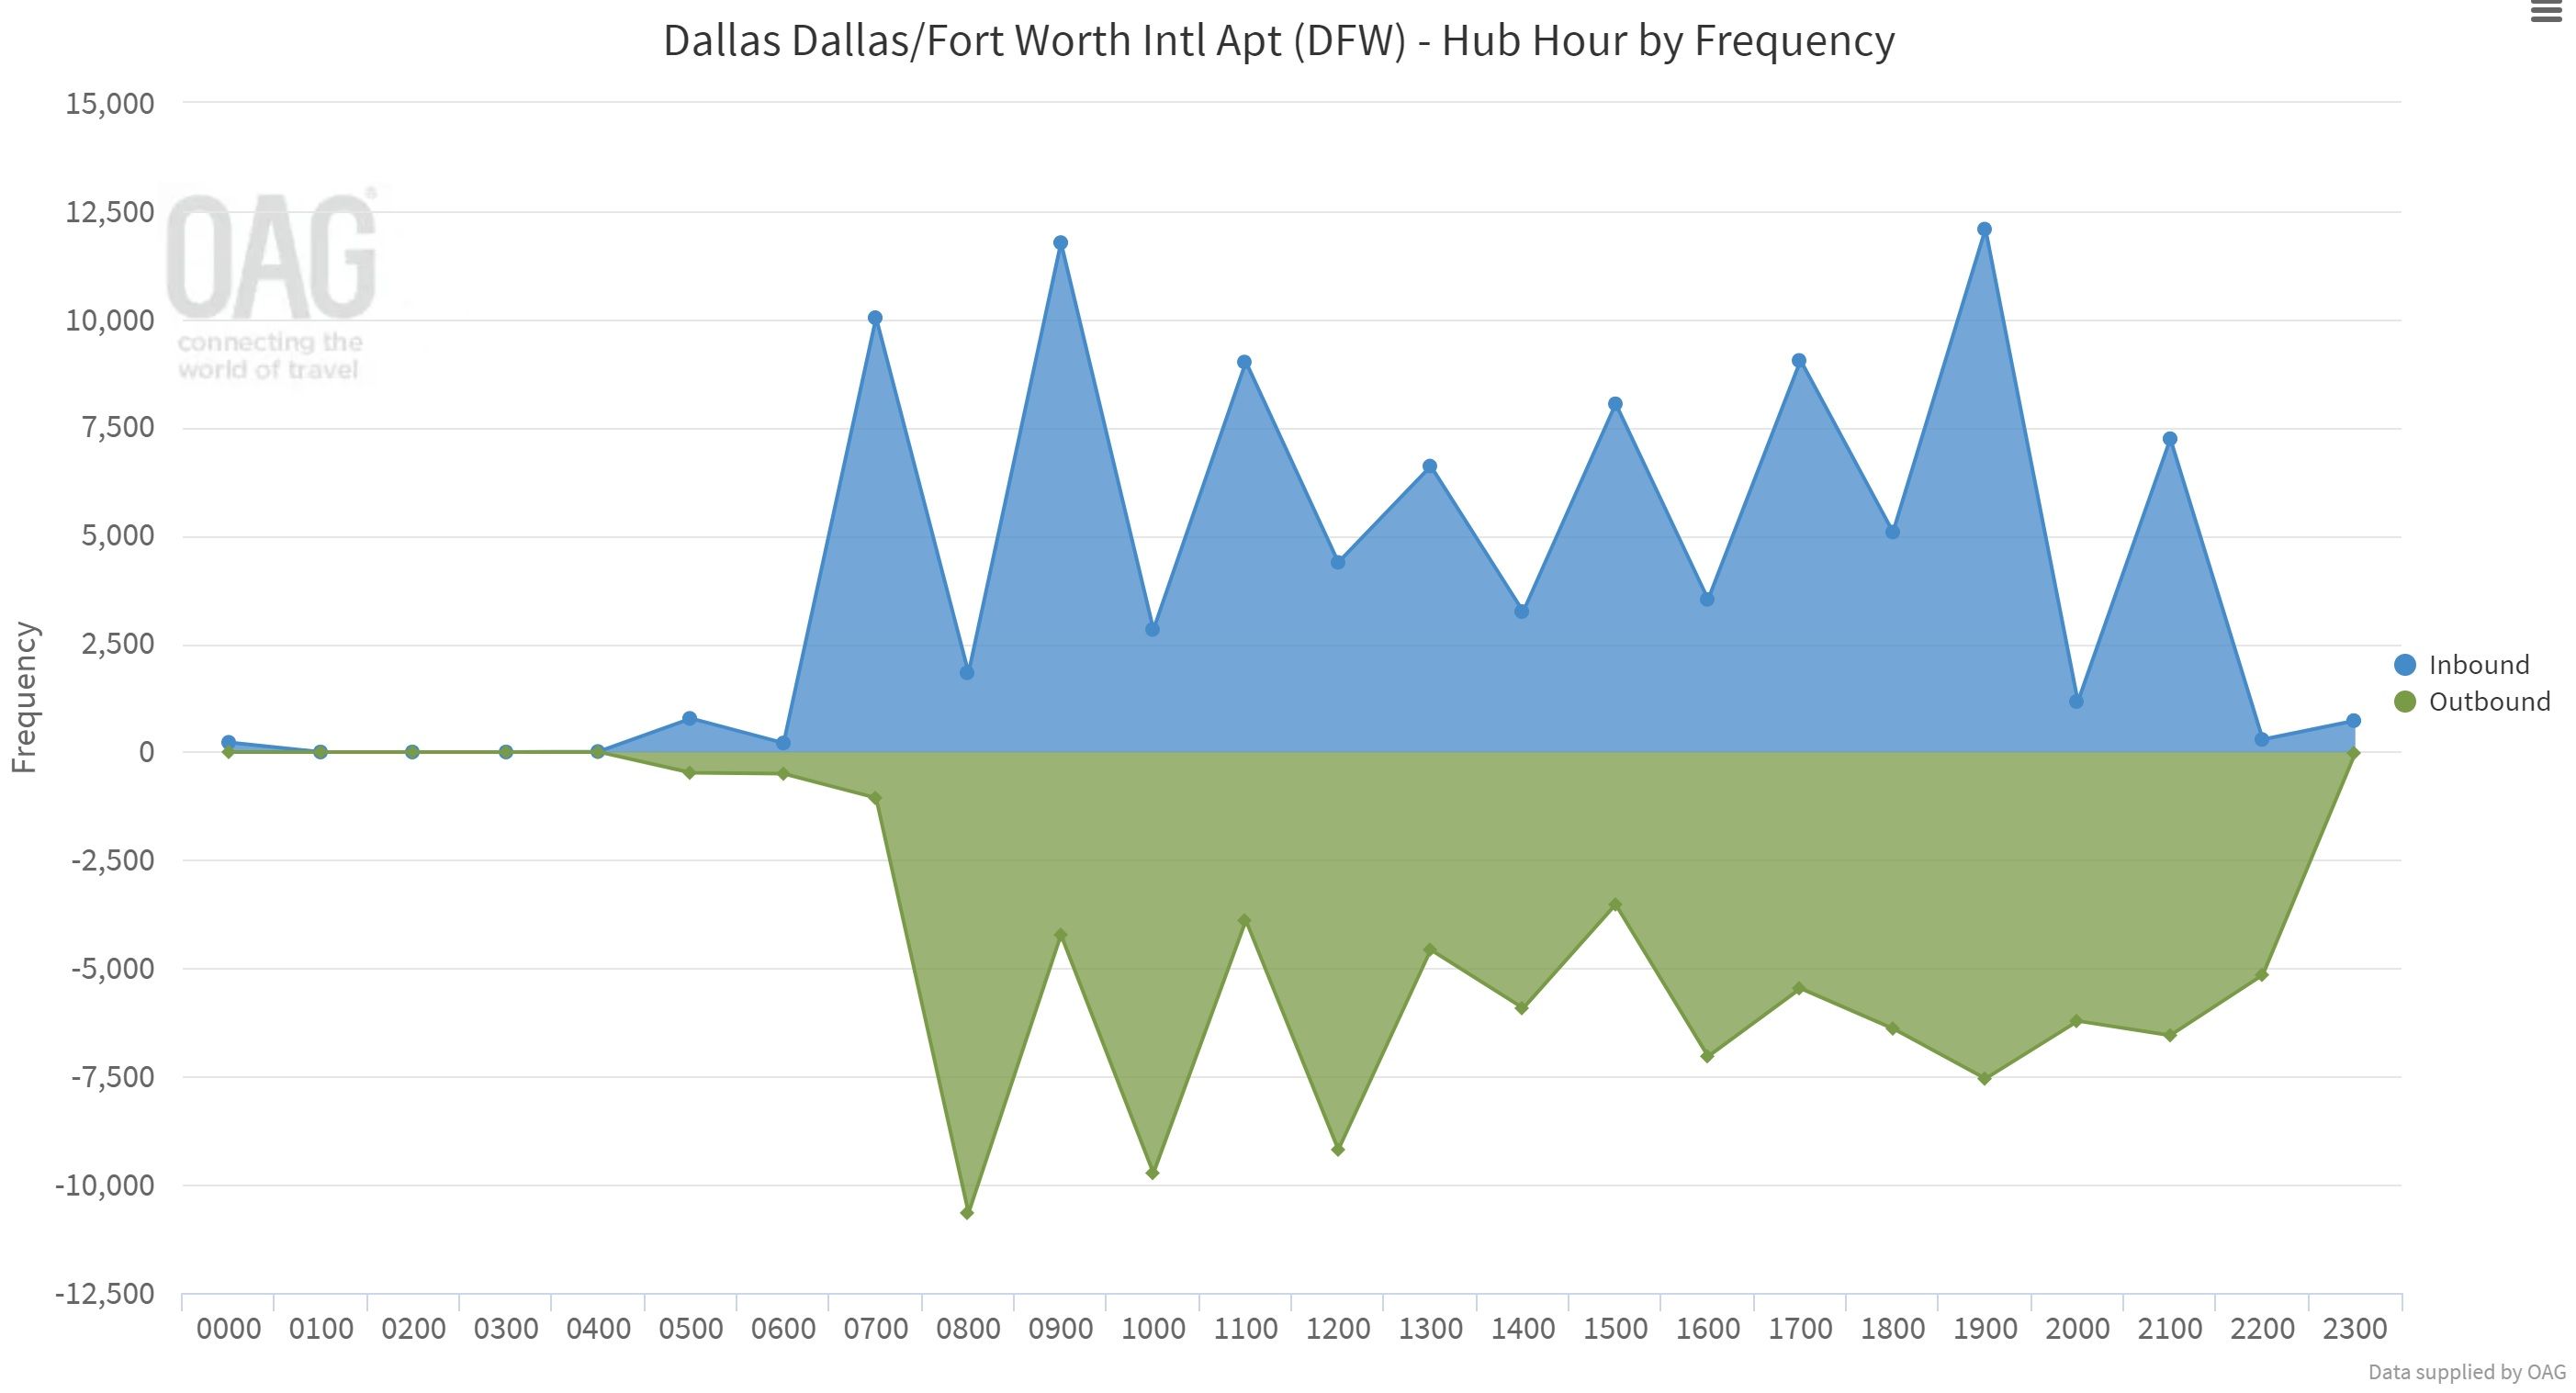
The diversity of aircraft types for the different markets and lengths of haul, and the coordinated nature of schedules for connectivity, often mean multiple periods of considerable activity. For American, it has various 'waves' of flights a day, each comprising one departure bank and one arrival bank, as shown above. This is key in frequency, usability, competitiveness, and total available O&Ds.
63% of passengers transferred
Relating US DOT T-100 data to booking information for January-May 2023 indicates that roughly 63% of American's Dallas passengers transited through the hub. Put another way, ~104,000 people connected there daily.
- Transferring at the Texas hub: about 15.7 million passengers
- Point-to-point (local; not transferring): around 9.1 million
Stay aware: Sign up for my weekly new routes newsletter.
Where did passengers go?
Breaking down the 15.7 million transit passengers suggests that just over nine million were domestic. With ~2.3 million, the US via Dallas to/from Mexico was the next biggest market, then Canada-US, Costa Rica-US, and Guatamala-US.
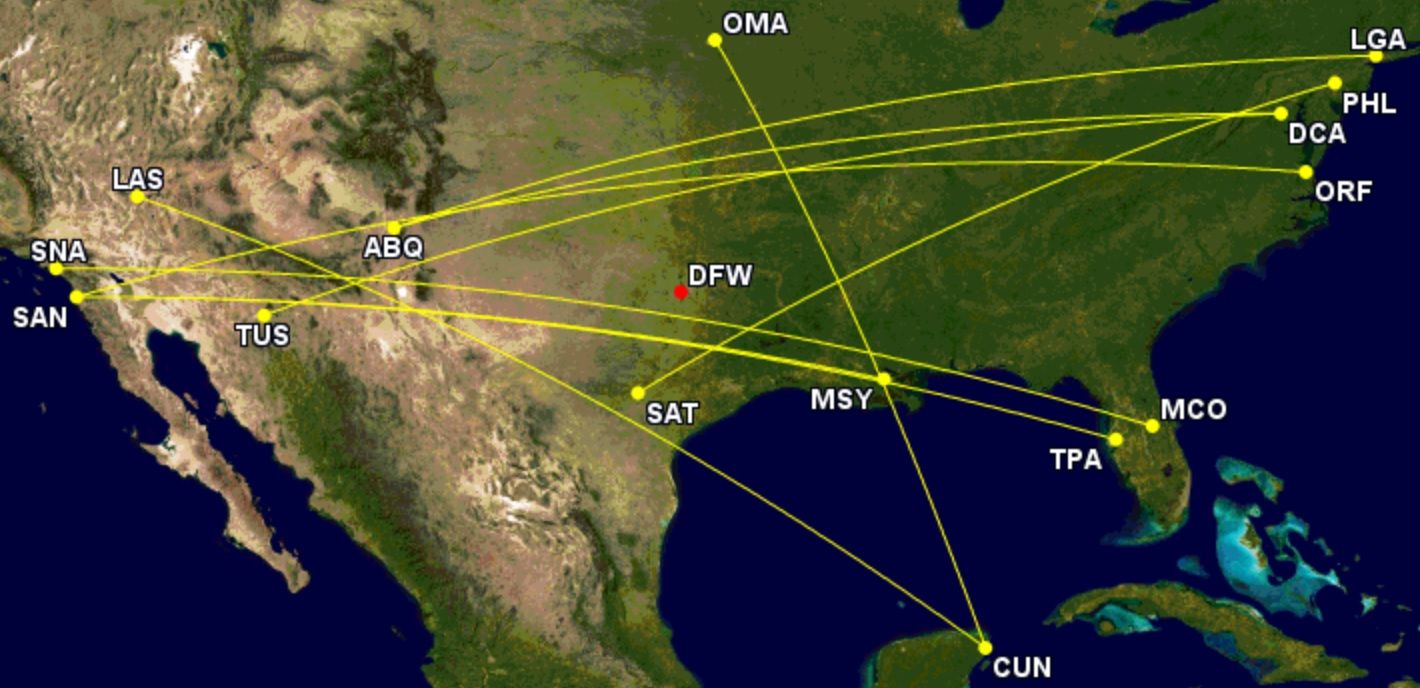
This January-May, more passengers transited over the Texas hub between Tucson and Washington Reagan than anywhere else. Doing so only added 10 miles (16 km) to what a non-stop would be. American carried ~19,200 passengers (127 daily), with the top 10 shown on the map below and in the following table.
This is at the airport level. At the city level, Los Angeles-New York was, not surprisingly, the most popular, closely followed by Albuquerque-New York.
Top 10 transit markets
American had more than 1,600 O&Ds with 2,000+ passengers (13+ daily), an eye-watering number, showing just how powerful its Dallas hub is. While the most popular 10 had 147,000 passengers, they accounted for just 0.94% of the connecting volume.
In other words, just one in 106 passengers flew them. This nicely shows how huge hubs typically revolve around many O&Ds and are not overly reliant on a few markets, spreading the risk.
Rank | Airport level O&Ds | Approx. daily passengers via Dallas | Find flights |
|---|---|---|---|
1 | Tucson-Washington Reagan | 19,200 | |
2 | Norfolk-San Diego | 19,100 | |
3 | Albuquerque-Washington Reagan | 16,000 | |
4 | Orlando-Orange County | 15,100 | |
5 | Philadelphia-San Antonio | 13,800 | |
6 | Las Vegas-Cancun | 13,600 | |
7 | Albuquerque-New York LaGuardia | 12,700 | |
8 | New Orleans-San Diego | 12,500 | |
9 | San Diego-Tampa | 12,400 | |
10 | Omaha-Cancun | 12,300 |
Did you transfer in Dallas this January-May? If so, where did you go? Let us know in the comments.
Sources: OAG, GCMap, booking data, US DOT T-100.


